Tuesday, May 19, 2009

The world in miniature

Okay, bear with me here, because when I first saw this, I thought it was about how to take photographs of miniature model landscapes - something I'd much rather leave to the more arts-and-crafty among us. But that's not what this is about.

This is about taking an ordinary photo, say of a real city or landscape, and making it look like it's depicting miniature models. Like the photo below... Toy boats on a miniature lake, right?


Nope, it's actually just a doctored image of a real life coastal landscape.

Trivial? Useless? Maybe, but check out how it's done.

TiltShiftMaker
is a site that does just that, and it does it very simply, by just reducing the depth of field of the photo: the portion of the photo that looks sharp and in-focus. Turns out, the shallower the depth of field, the smaller and closer the objects in a photo look, to the point of making real landscapes and buildings look like nothing more than miniature models.

The reason this works is that when we look at something small and close to our eyes, the portion of our field of vision that is in focus is very small. Conversely when we look at something very large and far away, the potion that is in focus is actually much greater. So when we notice a shallow depth of field, regardless of what we're really looking at, our brain signals SMALL and CLOSE (rather than BIG and FAR) and we use this to make a determination as to what we might be looking at - for example, tiny model boats as opposed to a life-size coastal landscape.

What fascinates me about this is that we do this entirely unconsciously. I didn't know anything about photography or depths of field before looking into this -- in fact I had to wiki depth of field to make sure I was talking about the right concept. But on some level, my brain did know. It's just one thing among a huge quantity of information that we unconsciously process in order to make deductions about the world around us from what is essentially a pretty limited set of sensory perceptions.

Here's other related example - it's a pretty common optical illusion.
Look at the image below... Concave or convex?


To virtually everyone the left side looks like buttons, while the right side looks like shallow holes. The interesting question, however, is why.

The answer is that we make the determination based on how the disks are shaded, interpreting the colors as light and shadow. If there is one thing we know intuitively (though perhaps not fully consciously) about light is that it tends to come from above - from the sun or from lamps. So a disk that is lighter on top we interpret as a protruding button catching light from above, whereas a disk that is darker on top we interpret as a hole shaded from above and catching light on the bottom.

In a way our minds are incredibly ingenious at noticing patterns in our perceptions and using them as clues to navigate the world around us, basically making educated guesses along the way.

But know enough about how the mind works, and you can easily trick it!

Via Apartment Therapy.

Art down the rabbit hole

A philosophy major turned artist, Maggie Taylor depicts a whimsical world that looks like something Lewis Carroll might have dreamed up had Alice's adventures through the looking glass led her into Monty Python's flying circus.


Check out Maggie Taylor's website for more about the artist and her quirky gorgeous works.

Wednesday, May 13, 2009

United Sins of America

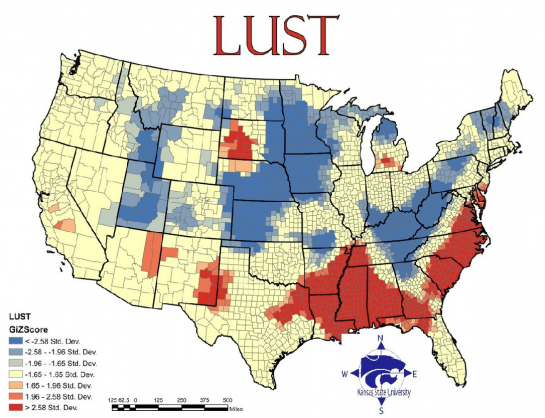
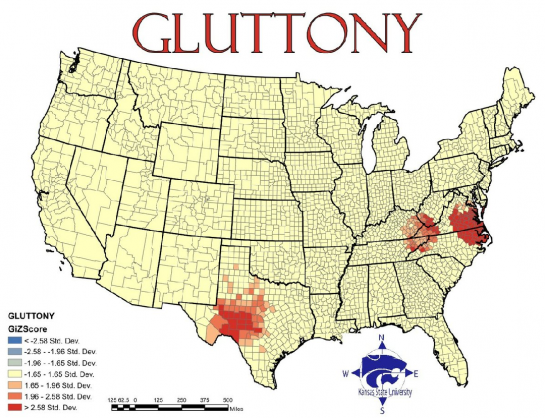
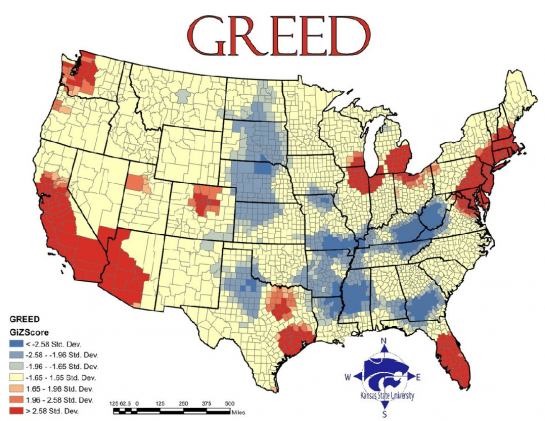
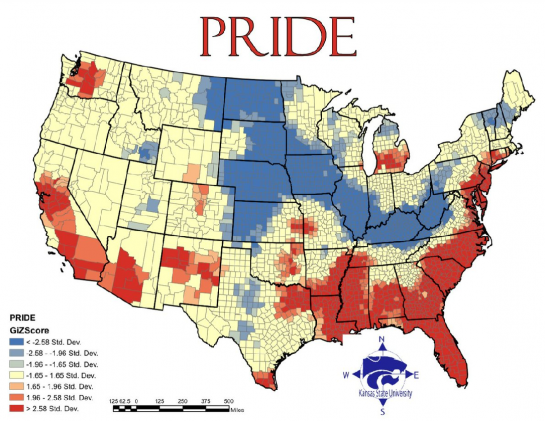
Theoretically interesting, but sketchy in its execution: geographers from Kansas State University create visual maps of the prevalence of the seven deadly sins across the U.S. using various statistics as a (tenuous) proxy for the country's sinfulness.


Lust: based on the incidence of sexually transmitted diseases. Because lusty people have unsafe sex and spread disease. Research courtesy of the Bible Belt!


Gluttony: based on the number of fast food restaurants per capita... While I definitely get the correlation between gluttony and fast food (big, cheap and FAST!), perhaps an obesity map would have worked better? All this shows to me is the homogeneity with which fast food franchises have colonized the country.


Greed: reflects average incomes versus total inhabitants below the poverty line... This one I believe is flawed. I can't think of a way of combining these two statistics to come up with a measure that would at all correlate to or even connote greed. The map too seems to indicate that they are simply equating greed with prosperity.


Sloth: reflects spending on arts, entertainment and recreation versus rate of employment... A bit uninspired, and ideologically flawed, but okay.


Wrath: reflects total violent crimes per capita. Sounds about right!


Envy: based on the total number of thefts... Seriously? San Francisco guiltier of envy than LA???


Pride: calculated as the average of the six other sins... because pride is the origin of all sins? Cop out.


So... I take it Heaven is full of mid-westerners.

Via Flowing Data and Revolutions.

Tuesday, May 12, 2009

A world inside a book

Brian Dettmer is an American artist, mostly known for his works involving alterations of existing media: books, maps, records, audio casettes...

Among his most fascinating pieces are his book carvings, turning ordinary books into sculptures and revealing their content as a three-dimensional work of art.

This one is entitled Science in the Twentieth Century.


Check out more of Dettmer's works on Flickr.

Found through Centripetal Notion.

Monday, May 11, 2009

Mad science?


While many people's reaction to this is likely to be outrage at the money we're wasting, In This Economy, researching pipe-dream theories... this is actually the sort of thing I love.

Wired Magazine outlines six of the most out-there fields being studied today.

My three favorites?
  1. Precognition (Daryl Bem, Professor Emeritus of Psychology, Cornell University)
  2. Disembodied Consciousness (Edward Kelly, Research Professor of Psychiatry and Neurobehavioral Sciences, University of Virginia)
  3. Telekinesis (Garret Moddel, Professor of Electrical, Computer and Energy Engineering, University of Colorado at Boulder)
Seriously, if there's a future out there where these notions become reality, sign me up!

Check out the article here.

The future of news visualization: Still waiting

Since my recent post about the inadequacies in current means of presenting news, I've stumbled upon another news site that seemed worthy of mention: MSNBC's Spectra Visual Newsreader.

And sure, it's visually intriguing, and surprisingly easy to use. It lets the user select specific interest areas, and then surfaces related news with a combination of text and images.


But still... I'm not convinced that translating news into a vortex of color-coded flashcards qualifies as a significant advancement in the field. It looks nifty at first, but it's not innovative in any meaningful way.

So yeah: no.

Sunday, May 10, 2009

Loftcube: Experimental temporary home design

Back to blogging about design...

Looking for a super-minimalist solution for temporary housing? Then consider the Loftcube concept: a small, compact, exquisitely designed living space constructed in the form of a lightweight cuboid. So lightweight in fact, that it could be transported from place to place via helicopter.


Loftcube is the brainchild of Berlin designer Werner Aisslinger.

And while I don't understand how they solve the problem of providing water and electricity to the unit (not to mention a functioning sewage system!) without compromising its mobility, it sure is a wonderfully creative bit of utilitarian design!

Thursday, May 7, 2009

Individuality?

A wise person once said, "There are only about 100 people in the world. The rest are just mirrors."

If this rings true or at least interesting, then check out this photography site.
"They call their series Exactitudes: a contraction of exact and attitude. By registering their subjects in an identical framework, with similar poses and a strictly observed dress code, Versluis and Uyttenbroek provide an almost scientific, anthropological record of people's attempts to distinguish themselves from others by assuming a group identity."


If you've ever questioned the fundamental premise of a group culture based on individual originality, this one's worth checking out.

Sunday, May 3, 2009

The future of news visualization

So I've been spending some time thinking about how news is conveyed, and I'm thinking we have room for some serious innovation...

Pick up a newspaper and what do you see, at a very first glance? Words. Black type on white. An image or two. Perhaps a big headline catches your eye and you read it; it registers in your mind as Big News. You read a few more articles. Now you know a subset of today's news, but little more.

Seems to me that a whole lot of information is falling through the cracks, and online news sources are not much better. Google News tried to create a richer news experience, by aggregating news from different sources and by organizing stories topically, but it wasn't a huge improvement.

Here are a few more interesting approaches:

Newsmap.jp I just discovered today, and it's quite smart: it displays all news on a single screen, color-coded by topic, with the biggest stories occupying the most real estate. The user can either search for a specific story, or filter based on topic, recency and geography.


Another conceptually interesting news site is BreakingNewsMap, which pinpoints breaking news on a world map in real time...

Unfortunately, despite its theoretical coolness, in practice it's too scattered and conveys information far too slowly (just one story every couple of seconds), so the user gets no sense for the big picture. I could imagine idly following it for a minute or so, but I would get frustrated pretty quickly.

What I want to see is a combination of the two... I like the idea of putting news on a map, but I want to see more stories at once, color-coded based on topic, featured more or less prominently based on how much buzz they're generating. I want to be able to apply filters to my news. I want to zoom in from national/world news to local and hyper-local news. Oh, and I want images too!

All you geniuses out there, make it happen!

Smile! Your future marriage might benefit!


A recent study, excerpted in The Economist, draws a possible connection between high school yearbook photos and divorce rates. As it turns out, the less people smile in their yearbook photos, the more likely they are to divorce later in life.

So... happy kids end up in happy marriages?

Or, considering the misery of high school for so many of us, is grinning for the camera just an indicator of one's ability to smile through the pain?

I am in a cynical mood today.